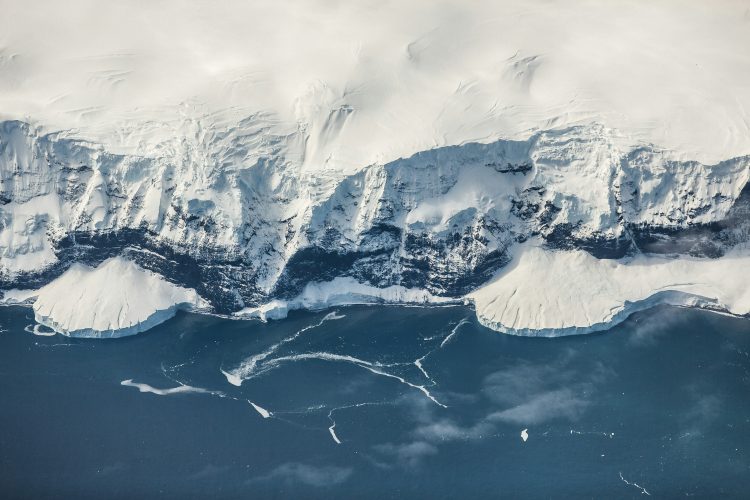
Large areas of Greenland or Antarctica’s margins melt each summer, affecting the ice sheet mass balance. This wet/dry snow state has been detected for decades using brightness temperature peaks at 19 GHz. However, L-band (1.4 GHz) data from the SMOS and SMAP missions also have a great interest due to their ability to detect wet snow at depth. SMOS has the longest temporal coverage (from 2010 to date), but melt detection suffers from the coarse spatial resolution of the L3 Brightness Temperature product.
For this reason, P. Zeiger informed us that a new brightness temperature product with improved spatial resolution has been developed at the Institut des Géosciences de l’Environnement. It uses SMOS Level 1C data around the 40° incidence angle to get an enhance spatial resolution (~30km). The new product is posted on a 12.5 km polar stereographic grid. It covers the entire Greenland and Antarctic ice sheets for 2010-2024, with twice daily acquisitions (morning and afternoon).
[sedoo_iframe src=”https://widgets.commoninja.com/iframe/5adc3b82-a76b-41a8-8ed0-30cf83b32d1a” width=”1000″ height=”500″ attributes=””]
Comparison of snow melt for 2010-2024 over Antarctica : former (left) and new (right) product. With a higher resolution, thinner zones of snow melt are detected, and the estimation of the average number of melt days is more important. In Antarctica most of the meltwater percolates in the snowpack or forms ponds on the surface, potentially destabilising the ice shelves, which underlines the importance of snowmelt monitoring.
The improved resolution shows a widespread and large increase in the average number of melt days in Antarctica and Greenland (in some places larger than 30 days per year !), compared to previous results. More information on his new article available here.
