
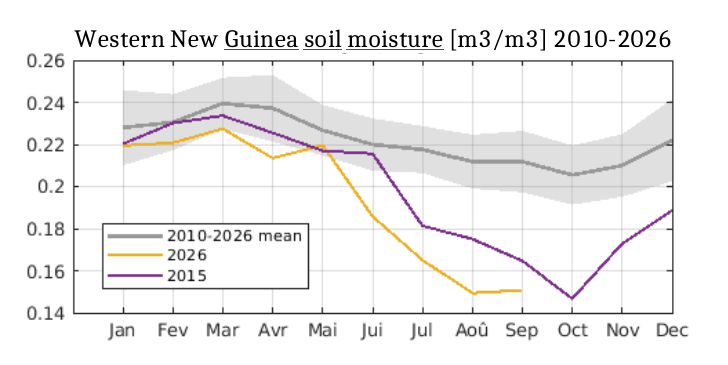
As an exceptional El Niño event continues to strengthen (with sea surface temperature anomalies now exceeding +4.0°C in some places of the eastern equatorial Pacific) (see also our previous post), how is soil moisture evolving in typically affected regions ?
Zooms over Indonesia and Central America, regions which usually experience precipitation deficits during El Niño events at this time of year. Satellite estimates (SMOS) show that 2026 surface soil moisture levels in these two areas have already fallen below those recorded during the previous “super” El Niño in 2015.
Status in Central America
In Central America, the moisture deficit has persisted for several months, reaching low records since July, despite a slight improvement in September in Nicaragua, Costa Rica, and northwestern Mexico.
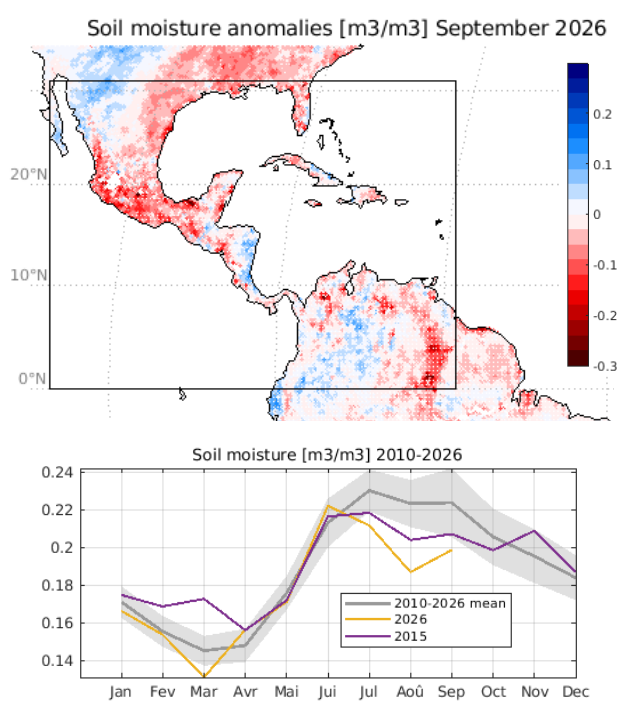
SMOS L3 soil moisture in the black box region. In light grey is represented the usual year to year variations 2015/2026 excluded (+/- 1 std), in purple 2015 El Niño, in yellow the current event.
Status in Indonesia
Meanwhile, Western New Guinea experienced in Aug-Sept exceptionally low soil moisture (< 0.15 m³/m³, which is approx. 0.1 m³/m³ below mean values). The broader Indonesian region is particularly prone to human-caused wildfires, which have been exacerbated by these drought ahead of schedule (since August, over 1 million ha have burned in Indonesia alone).
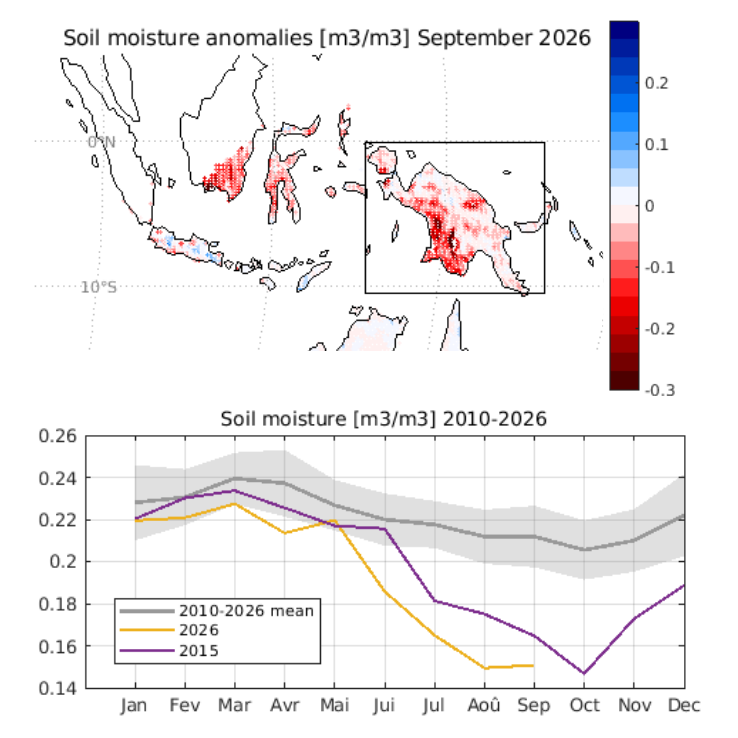
SMOS L3 soil moisture in the black box region. In light grey is represented the usual year to year variations 2015/2026 excluded (+/- 1 std), in purple 2015 El Niño, in yellow the current event.
The Hovmoller below, plotted for the Western New Guinea area, depicts soil moisture anomalies for previous El Nino events (2015, 2018, 2023) and for current event. So far, 2026 has set records in term of drought amplitude in the region.
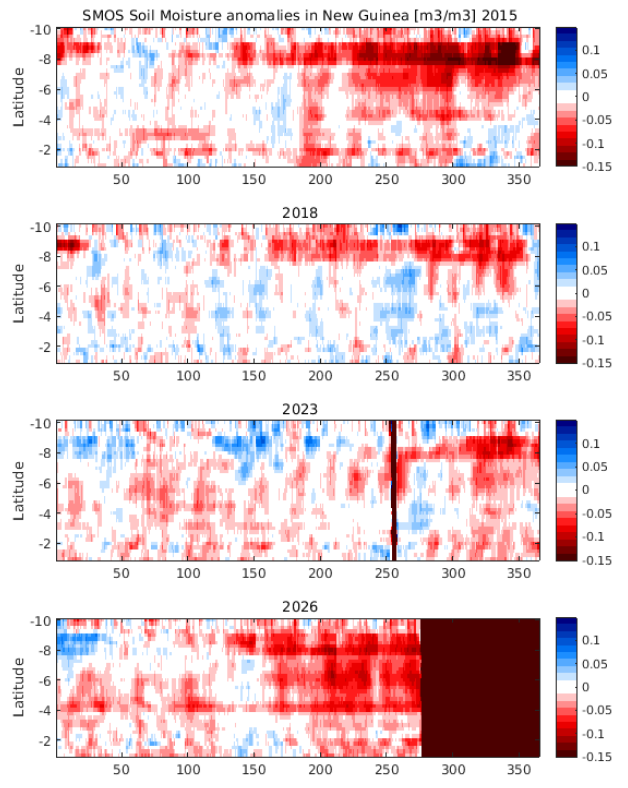
Data : SMOS L3 Hovmoller depicting the strength of the current ENSO in Western New Guinea (anomalies are averaged for the black box region)