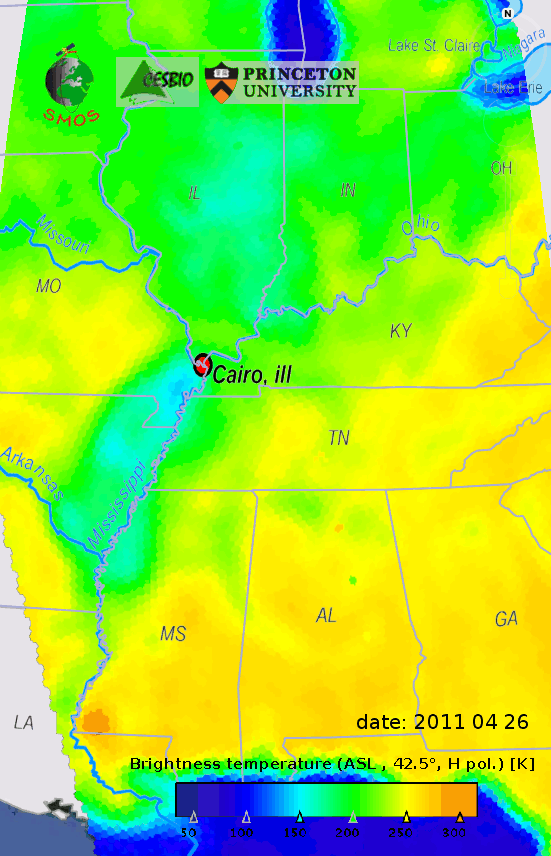
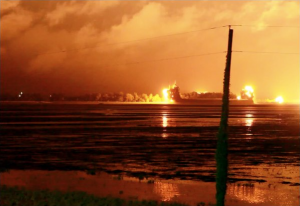
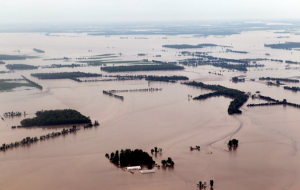
The situation…floodings and levee blastsAfter floodings in the Upper Mississippi Basin due to snowmelt, the Lower Mississippi Basin is now getting flooded due to heavy rainfall. The US Army corps of engineer blasted on the 1st and 2nd of may 2011 11,000 feet of Mississippi river levee downstream of the town of Cairo Ill , located at the confluence of the Mississipi and the Ohio rivers, to save the town after the water in the Mississippi river reached record heights (61.7 feet). The highest recorded height at Cairo, Ill was 59.5 in 1937. This flooding is still underway and officials in Louisiana and Mississippi are “warning that the river could bring a surge of water unseen since the Great Mississippi Flood of 1927 ». People were still being evacuated in several towns in Southern Illinois on the May 9 2011. Monitoring the Flood dynamics with SMOS observationsProf. Eric Wood from Princeton University was at CESBIO this week. He showed us this article in the New York Times. So we had a look at the SMOS data with him and his team back at Princeton University. We selected the brightness temperature in horizontal polarization at surface level interpolated at 42.5° (TBh 42.5) to inspect this event. The brightness temperature is expected to be low (at about 150 K) over free water surfaces as you can see over the Michigan lake in the provided images. Persistent low brightness temperatures are indicative of the presence of large areas covered with water. Before the actual flood, the rain events are visible on the SMOS products as in the image aquired on the 23rd of April. It is then easy to spot areas flooded after the significant rain and before the levees were broken by US Army Corps of Engineers. The most impressive is the flooding depicted in the products acquired on the 3rd of May at 6h00 am (ascending orbit) and 6h00 pm (descending orbit) so hours after the last blasts. It shows how the muddy torrent surged into the Illinois plains. The levees were blasted on May 1 and 2 and the released water spreaded south west of Cairo Ill.
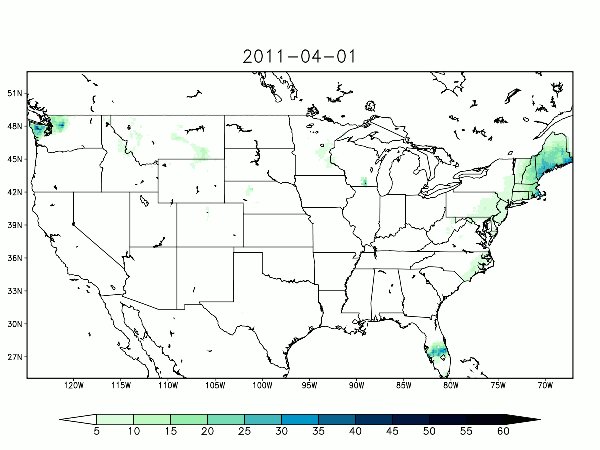
The high receptiveness and all weather capabilities of SMOS show the dynamics of the flooding. You can follow the complete event by looking at the animated gif we added. It shows 16 SMOS visits from April 20 2011 till May 8 2011. The colder brightness temperatures (blue color) can be associated to free water after a rainfall or due to flooding. It is easy to differentiate the two by looking at the animated gif of the observed daily precipitations from LDAS that we also added. Will comparing remember that the SMOS acquisition is at either 6h00 am or 6h00 pm local time and that precipitation is from daily average so this takes into account cloud movement.
We will continue to monitor this event at CESBIO trying to check the areas were levees are breached or blasted as the Corps fights against waters and hoping the water management structures will resist.
Cheers Ahmad |
       |