Since the end of July Northern Pakistan has been affected by the worst floods in living memory – according to government figures almost 14 million people have been affected.The United Nations believes 1,600 people have already died due to the floods. The magnitude of the disaster is so important that flooding can be followed by SMOS. The following pictures show Pakistan soil moisture map at previous and post disaster.
 |
 |
 |
|---|---|---|
 |
 |
All soil moisture maps available over Pakistan between the 1st of July and two days ago, were put on Google Earth. The time series clearly shows changes at the end of July with increase of soil moisture values. The affected area are very well captured by the soil moisture maps and in accordance with the disaster maps are provided by the International Disaster Charter activated the 1st August 2010. The high temporal frequency and the ability to “see” through clouds allow to SMOS to provided crucial information in this case, despite its low resolution. The significant topography does not seem to be a major limitation for soil moisture retrievals in this particular case.
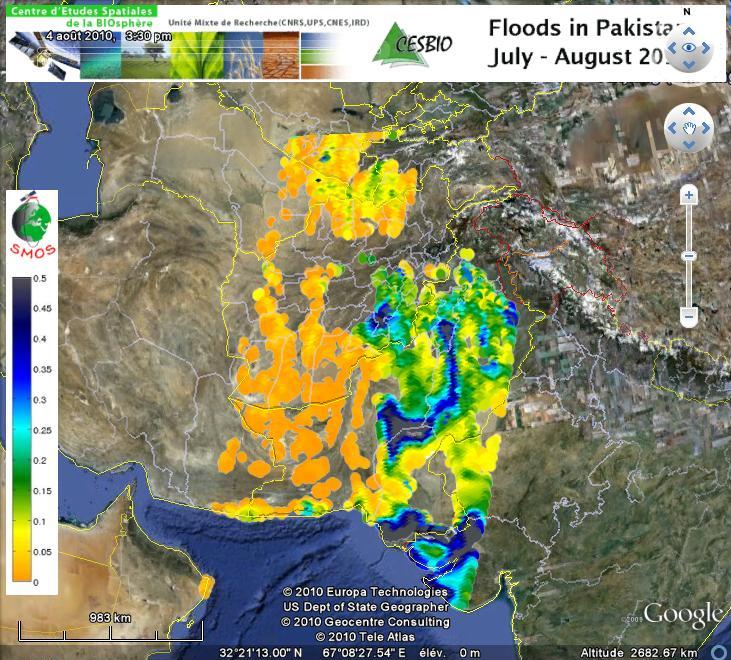
So even though has a coarse spatial resolution it seems to be compensated by the all weather and frequent acquisition. It is also expected that, once the retrieval algorithms are tuned and fully validated, such information could be used to infer more accurately the actual extend of the flooding helping both to improve locally weather forecasts and possibly provide useful information for the relief team on the ground.
Claire, bravo pour ces images!Comment avez-vous attaqué la contamination du RFI sur cette zone pour produire ces retrievals?
Merci Joaquin, nous sommes également ravis des résultats prometteurs obtenus ! Concernant les RFI, le bassin du fleuve Indus n’est que faiblement affecté par les RFI et les pixels trop contaminés ou correspondant aux sources ponctuelles ne sont pas inversés.Les snapshots et inversion de l’humidité du sol du 4 août après midi :Températures de brillance en polarisation XTempératures de brillance en polarisation YHumidité du sol
Well done, such maps can be a good input for Disaster management activities, is this possible to get SMOS data sets for Pakistan Flood reasrch? How?
Unfortunately, SMOS data are not yet available. \nWe will inform you on the blog as soon as data become available.