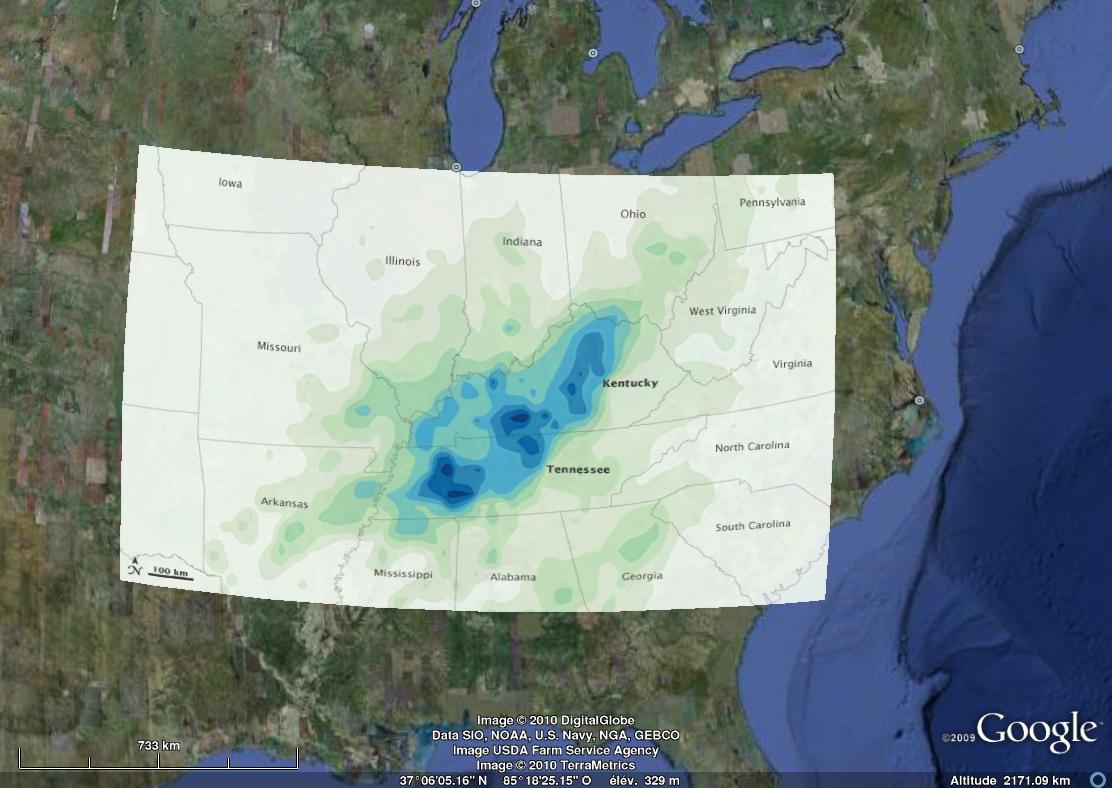
Extreme rainfalls occurred in the USA on May 1st 2010, causing flooding over Tennessee. Figure 1 reports the amount of precipitations between May 1 and May 3, 2010.
This was well captured by SMOS. The series of following images shows a temporal variation of the soil moisture derived from SMOS (Operationnal products) from 28 April 2010 (before the event) to May 5 (a few days after). The time reported in captions are in UTC. The local time can be obtain by adding 5 hours (eastern part of the Images) and 6 hours (on the western part).
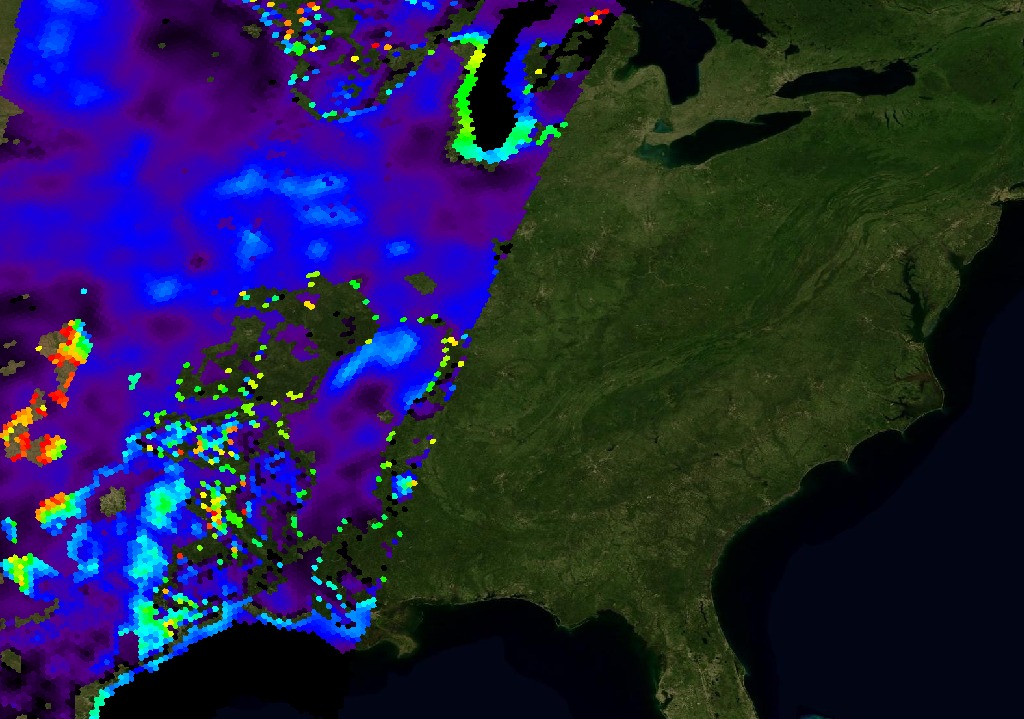

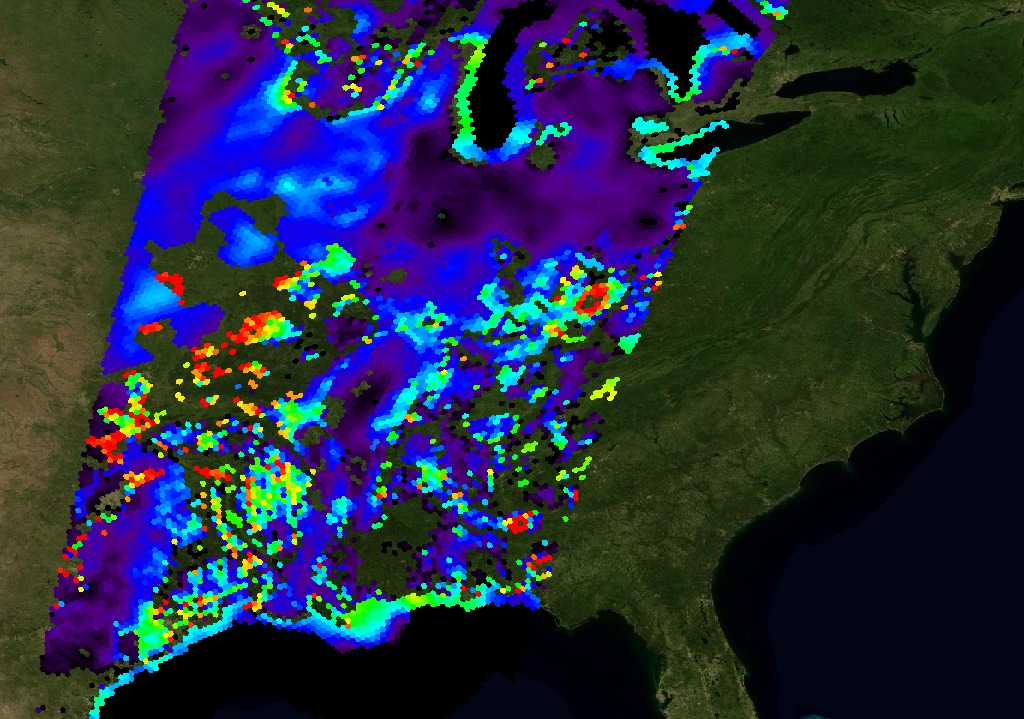
- Fig 4 : Soil Moisture from SMOS, 29 April 2010 (10h40 UTC time)
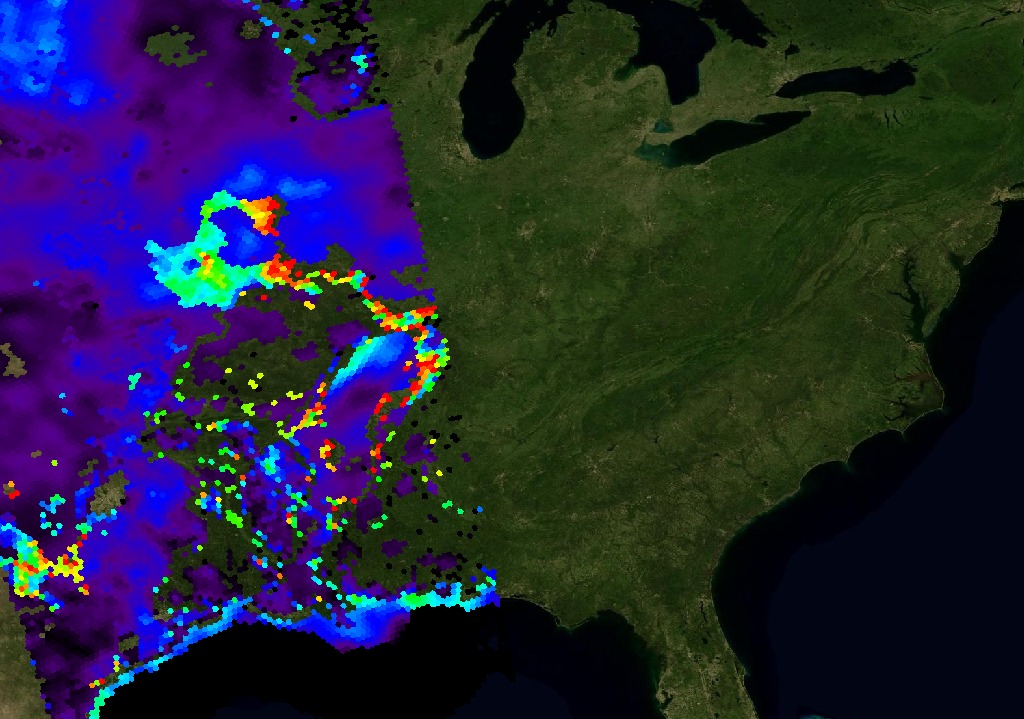
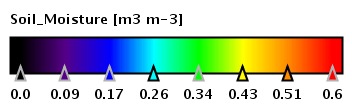
These images 2 – 4 (see above) show the soil moisture distribution before the events. The values are between 0.10 m3/m3 to 0.2 m3/m3 (purple, bue color)
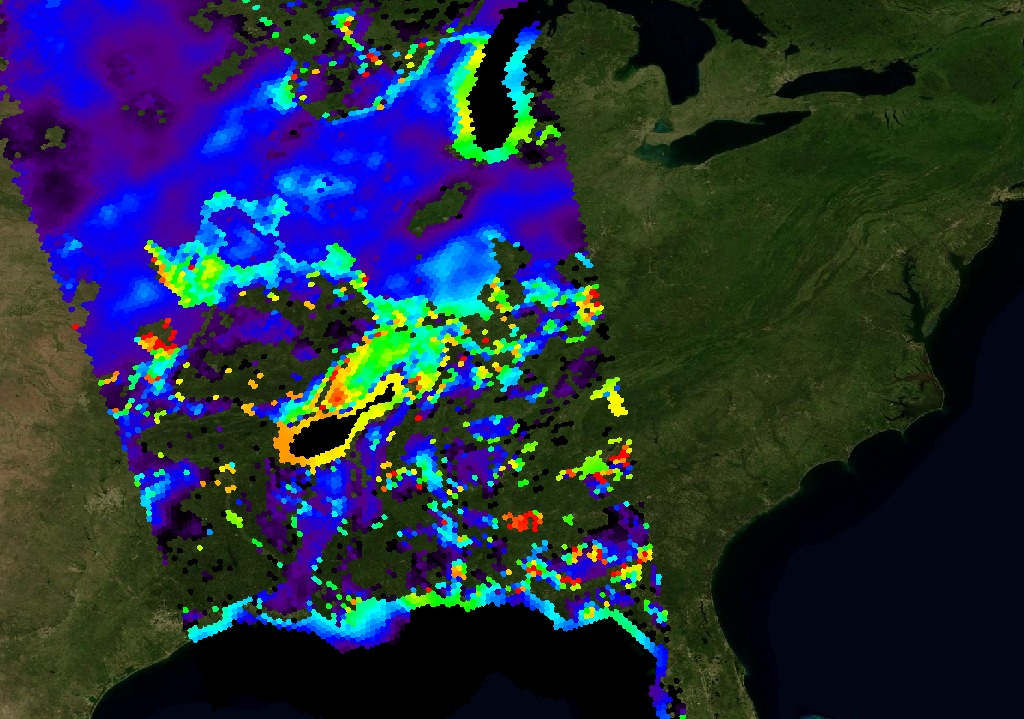
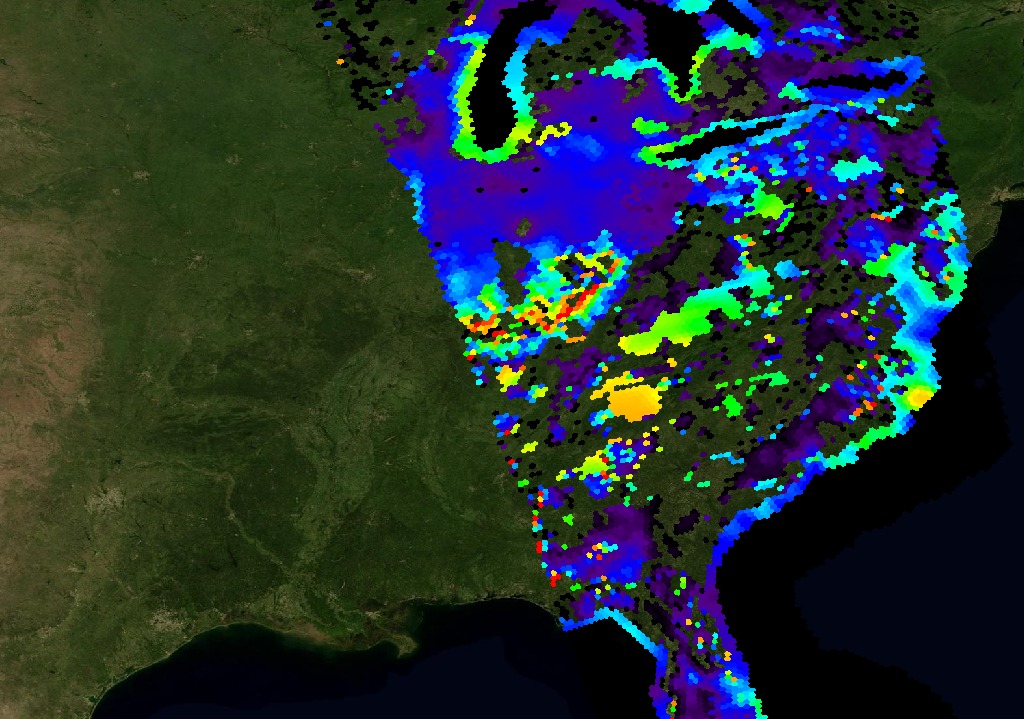
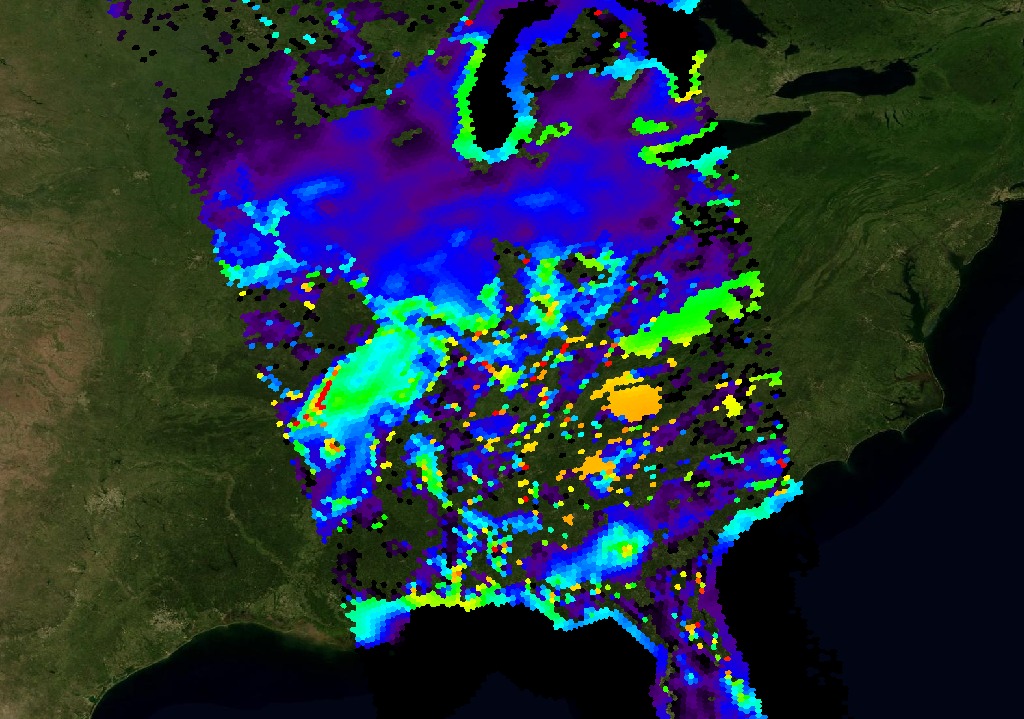
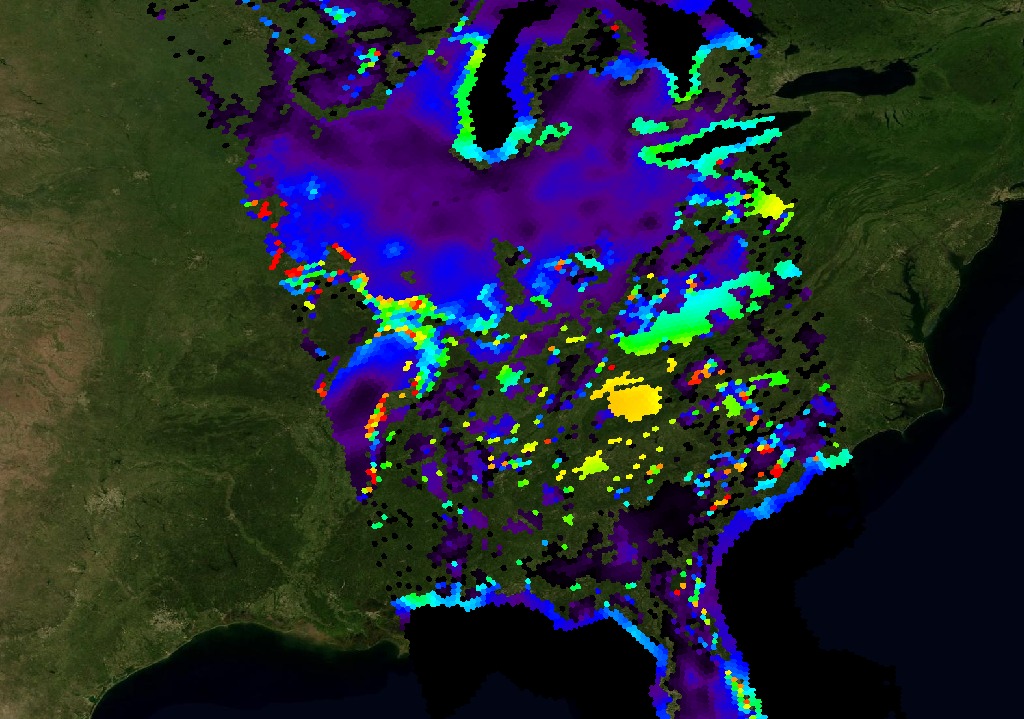
The last 3 pictures (Fig 6, 7 and 8 ) clearly depict an increase in soil moisture. Actually, the SMOS mission is in its validation and calibration process, meaning that the algorithm to retrieve soil moisture is still under study (one can notice some missing values on the picture). Then, we won’t discuss about the absolute soil moisture values by the time being. But it is interesting to note the response of the SMOS soil moisture to the heavy rains. On May 1st, the rains brought an important amount of water in the soil, leading to an increase in soil moisture (see Figures 5 6 and 7) . The surface even got flooded, which explains the high values retrieved from SMOS. It may also explain the black patch on Fig 6 (Soil Moisture from SMOS, 01 May 2010 , 11h00 UTC time). A few days later, May 4, the soil is still wet as shown by the green color.
Still some interesting work to do and issues to tackle but these first results are very encouraging.