Early February 2012, the Eastern part of Australia was hit by important rainfalls, and the cyclone Jasmine reached the Northern part of the country (http://en.wikipedia.org/wiki/Cyclone_Jasmine). The Australian Bureau of Meteorology records the amount of precipitations, as shown in the following figure which is the cumulative precipitation between the 1st and the 7th of February. As a consequence, Eastern Australia suffered from serious floods. See the following reports:http://articles.cnn.com/2012-02-04/asia/world_asia_australia-floods_1_flood-waters-flood-warnings-higher-ground?_s=PM:ASIAhttp://earthobservatory.nasa.gov/NaturalHazards/view.php?id=77101http://www.abc.net.au/news/2012-02-05/residents-warned-to-leave-while-they-still-can/3812386The SMOS mission clearly sees these events. The following figure represents the average soil moisture for the first week of February. Only ascending overpasses are selected, meaning that the soil moisture is measured at about 6 a.m. local solar time. The afternoon overpasses present the same pattern. The area with a soil moisture higher than 0.5 m3/m3 (dark blue / grey) depict flooded areas or saturated soil. Note that the pattern of the precipitations and the SMOS soil moisture are well correlated (R=0.72).
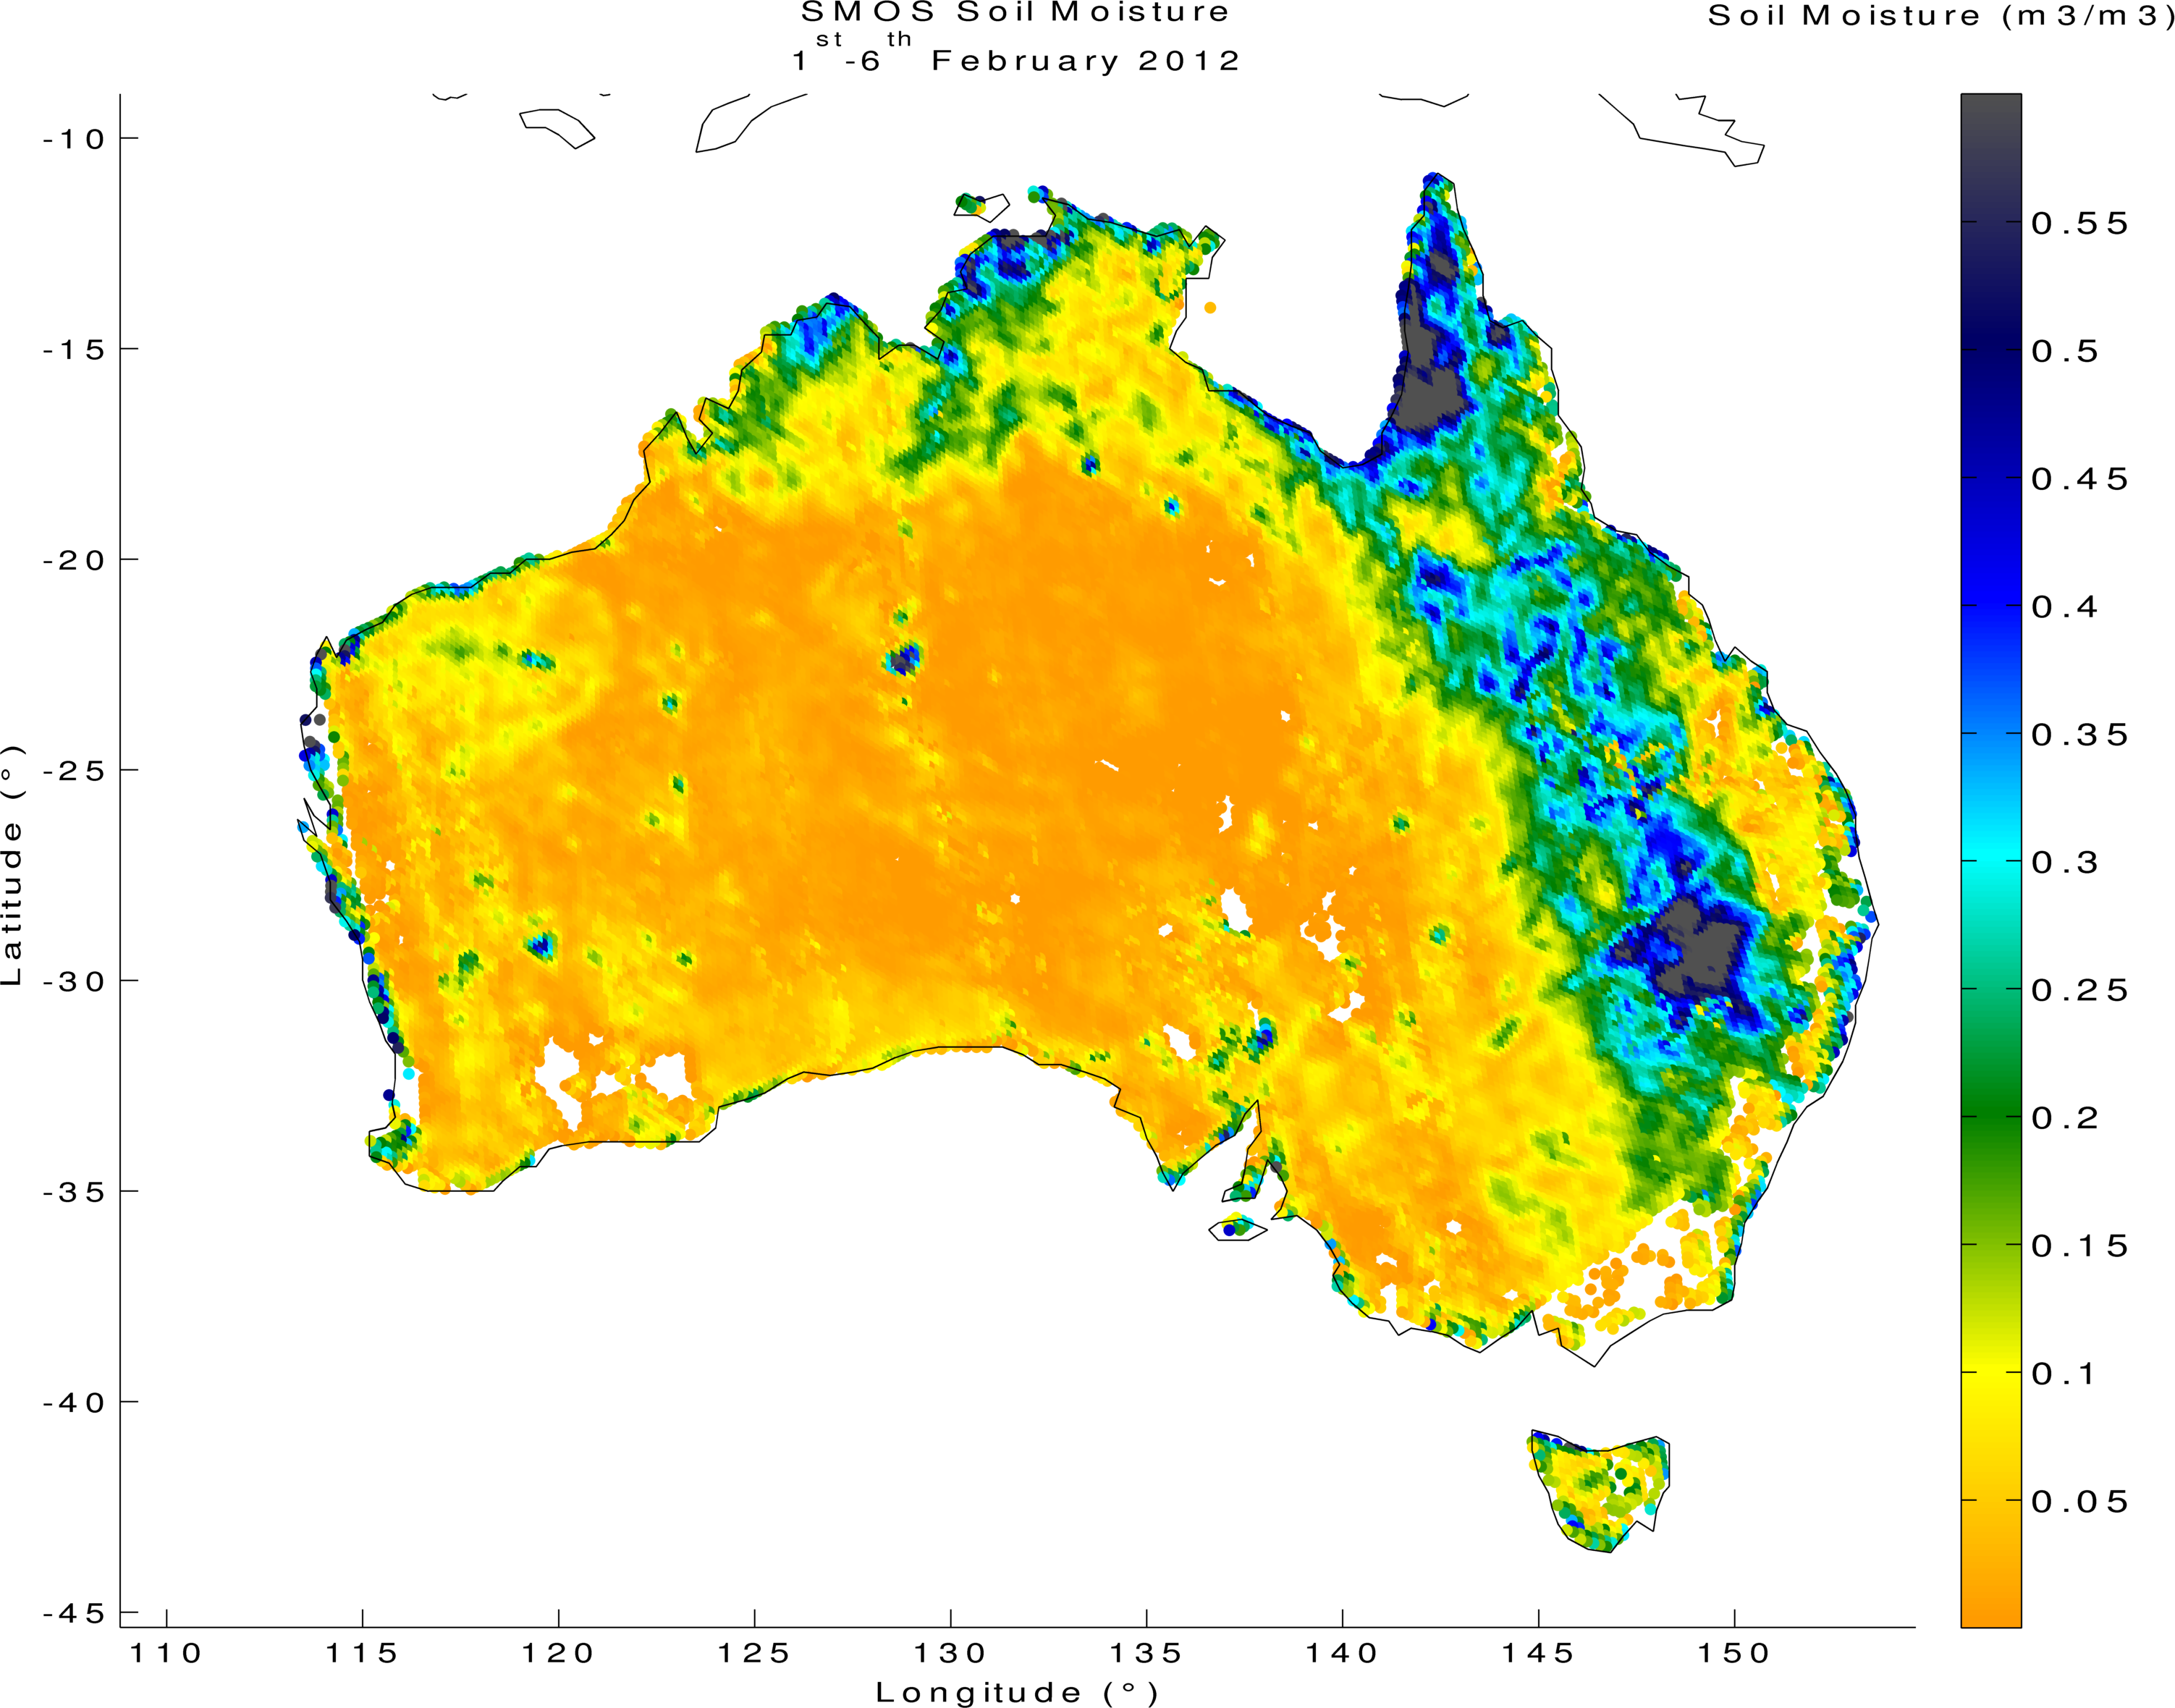
One thought on “Important precipitations in Australia”