
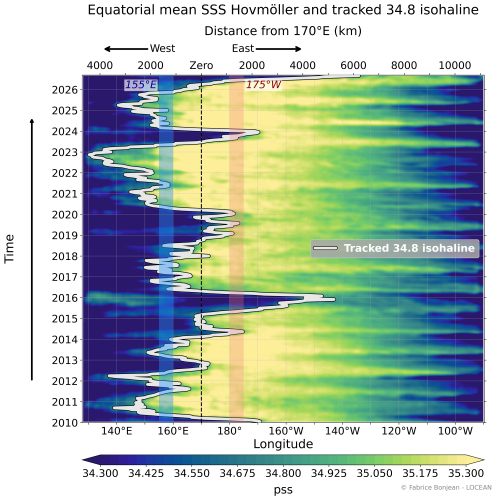
Fabrice Bonjean from LOCEAN has set up a very nice page to view El Niño (ENSO for El Niño Southern Oscillation). His page is a scientific demonstrator. It shows how satellite sea surface salinity (SSS) can help monitor El Niño–Southern Oscillation (ENSO) from an independent ocean-salinity perspective.
The dashboard below focuses on the most recent three years, ending with the latest available SSS field. The upper panel shows sea surface salinity in the tropical Pacific, with the 34.8-pss isohaline marking the eastern edge of the western equatorial fresh pool. The red circle/ellipse highlights the tracked fresh-pool edge between 2°S and 2°N. The lower panel shows the synchronized evolution of the SSS-based ENSO indicator.
The evolution can be monitored since 2010 thanks to SMOS on Fabrice’s page which is regularly updated to follow almost in real time what’s happening.
So check it out!