In January 2013, ex-Tropical Cyclone Oswald passed trough parts of Queensland and New South Wales, Australia, causing widespread turmoil including storms, at least six tornadoes over south-eastern Queensland, and severe flooding in many areas within 200km of the coast. Coastal regions of Queensland were the most impacted with Mundubbera, Eidsvold, Gayndah and Bundaberg in the Wide Bay-Burnett hit severely.
For more information about this event: http://en.wikipedia.org/wiki/2013_Eastern_Australia_floods
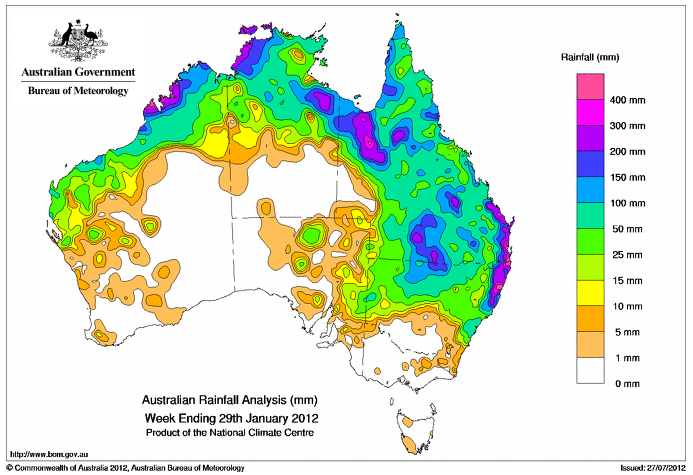
The Australian Bureau of Meteorology recorded the amount of precipitations (as shown in the following figure), which is the cumulative precipitation between the 23rd and the 29th of January.
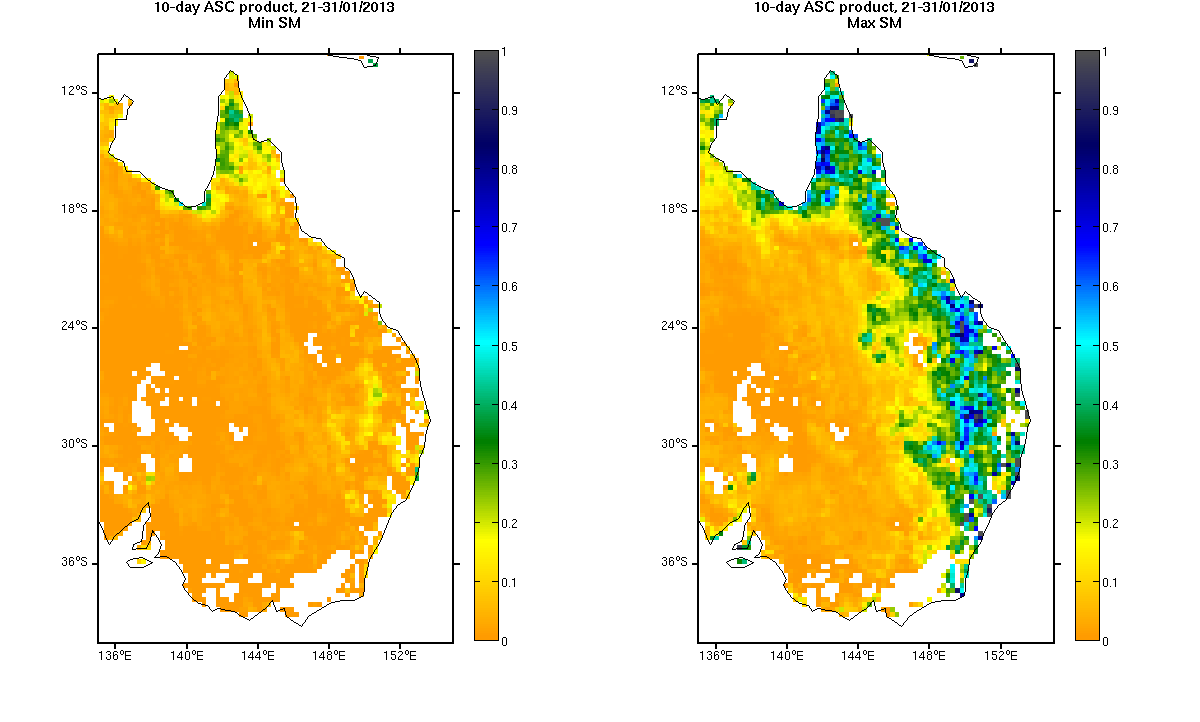
At the CATDS, the 10-day product covering the end of January shows a large difference in soil moisture during this period. In the figure below, the left plot shows the minimum value of soil moisture recorded between the 21st and the 31st of January, and the right plot shows the maximum value of soil moisture over the same period.

The Weather Bureau said that the flooding could have been worse if the region wasn’t so dry before the rain started. The CATDS saw both conditions: a dry spell in the middle of January, and a significant increase in soil moisture after the cyclone.

