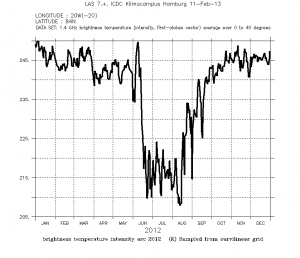
The Team in Hamburg (Institut für Meereskunde at KlimaCampus / Universität Hamburg) is working on thin sea ice detection and monitoring (see our previous blog posts on the subject). Dr. Lars Kaleschke and his team has now produced a Live access Server enabling to create interactively time series as shown on the examples below. Also check: http://icdc.zmaw.de/l3b_smos_tb.html?&L=1 and http://www.arctic.io/2013/2/smos-brightness-temperature
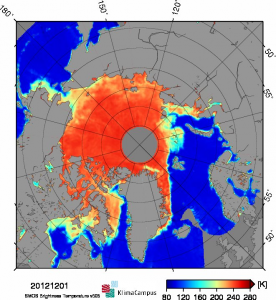
Figure 1: Mean daily brightness temperature (TB) intensity in the Northern hemisphere over open water, sea ice, and some of the adjacent land masses for December 1, 2012.
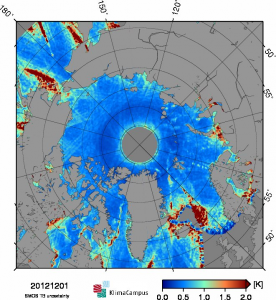
Figure 2: Corresponding standard deviation (uncertainty) calculated as the variation of TB data pairs of the respective grid cell.
 Figure 3: Example brightness temperature time series of the sea ice north of Greenland as generated with the Integrated Climate Data Center (ICDC) Live Access Server (LAS).Link to ICDC: http://icdc.zmaw.de/


